To design drivetrain systems to meet NVH targets, we need a simulation tool that performs quickly for any proposed design changes, whilst being accurate and reliable.
In this blog, I will show you validation work of MASTA software against NVH modal test data on a single-speed, two-stage EV gearbox casing half.
I will also explain how I used scripting capabilities within MASTA to make the validation process easy and adjusted to my own specific requirements.
Modal testing with either hammer or shaker excitation is used extensively in research and industry as a means of finding the modal properties of an object, including resonance frequencies and damping.
When modal test results are compared to simulation results, it is possible to ensure that the simulation model was created accurately and make suggestions to improve the model.
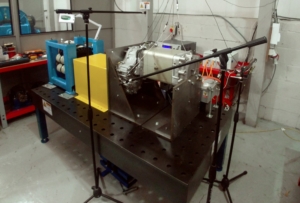
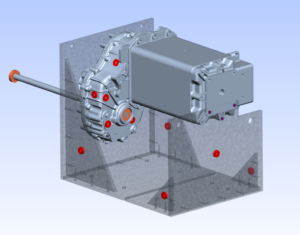
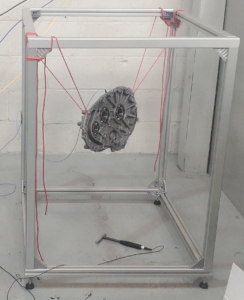
EV test rig and equivalent MASTA model
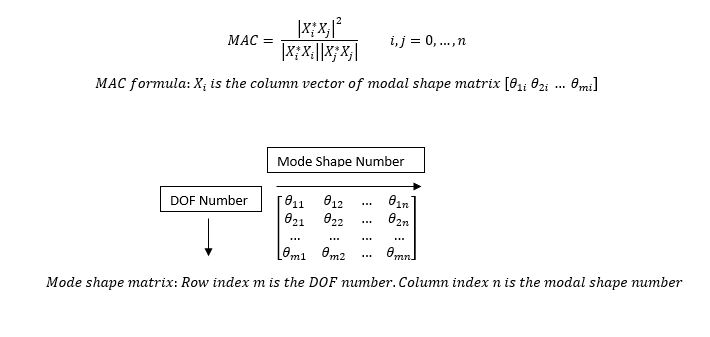
A common method for evaluating modal test data against simulation is the Modal Assurance Criterion (MAC).
MAC analysis ensures that all the relevant modes in the system have been compared from use of multiple accelerometers across the gearbox surface and uses a simple formula to compare the modes rather than having to rely on comparison by eye.
In the MAC formula above, i and j refer to the test and simulation modes.
Column vectors from each mode shape matrix are compared to calculate a matrix of MAC values.
A value of 1 means that the mode shapes match exactly and a value of 0 means they do not match at all.
Let’s Get Started
I carried out the test as follows using a roving accelerometer method.
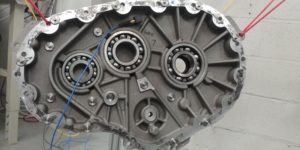
The test piece was hit with an impact hammer in one location whilst a single triaxial accelerometer was moved between multiple locations in order to build up a full picture of the mode shapes.
The hammer was impacted three times for each accelerometer location in order to average results and check the test repeatability.
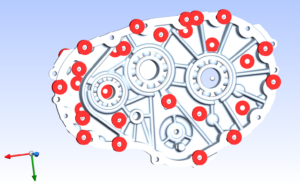
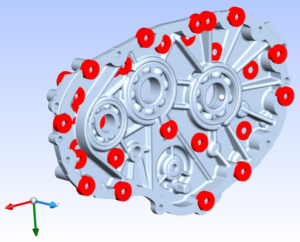
Accelerometer locations were chosen in order to get a good geometrical representation of the structure, with some practical limitations on placement due to rib locations.
Half casing test setup
Half casing MASTA model
I set up an equivalent MASTA model by using its dedicated FE functionality to import an external FE mesh of the gearbox casing half.
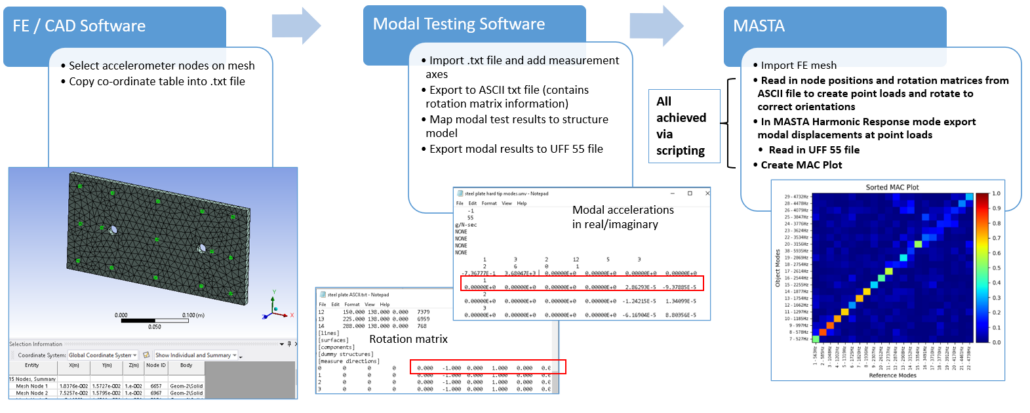
In order to make the validation process efficient we developed a Python script using MASTA scripting.
The script can read a text file of accelerometer positions into MASTA and automatically create accelerometers at these positions to connect to the FE casing mesh.
The script then takes modal results from MASTA NVH mode and then compares with a results file from test in order to generate MAC and frequency difference results.
The modes are sorted so that the highest MAC numbers are on the diagonal.
The script can also compare test results with itself in order to check enough accelerometer positions were used to generate the mode shapes of each structure.
MAC plot test vs simulation Python tool process
What Did We Find?
When the hammer is impacted three times for one accelerometer location an FRF and coherence graph is generated for each accelerometer axis.
The coherence is used to check the repeatability of the hammer tests, here it is close to 100% at most frequencies which means good repeatability, with low coherence at frequencies where there are antiresonances in the FRF as expected.
Half Casing FRF and Coherence Results
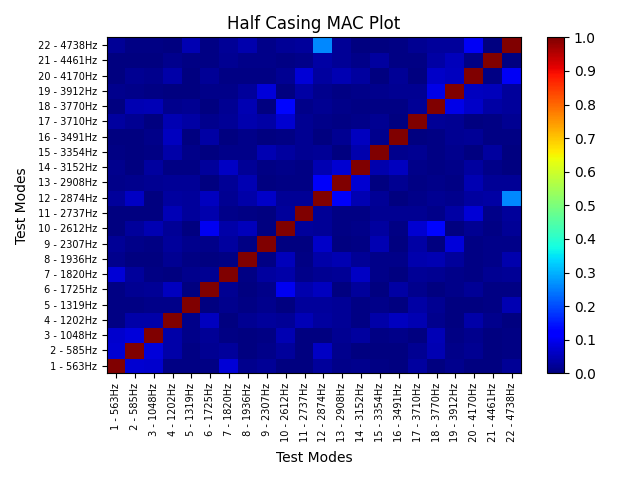
It can be seen there are a minimal number of off-diagonal terms on the test vs itself MAC plot suggesting enough accelerometer positions were used to find the full mode shapes of each structure.
If high off-diagonal terms are seen this is referred to as “spatial aliasing”.
MAC plot test versus itself for half casing
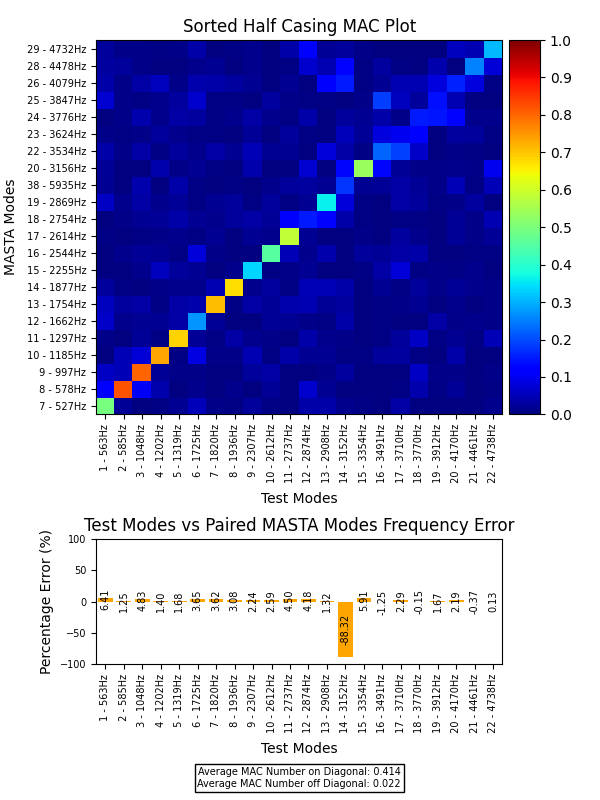
The test versus simulation MAC plot gave very good correlation up to ~ 3 kHz with correlation generally weakening as frequency is increased.
This is to be expected, first due to the known roll-off in force amplitude of impact hammers as frequency increases, second the accelerometers sensitivity increases as frequency increases and they are closer to their resonance point, third at higher frequencies the structural response will be more sensitive to small variations in material properties, geometry and boundary conditions and so a single FE model will be less reliable.
Frequency differences between modes are mostly under 5% which suggests the mass and stiffness of the casing has been modelled accurately.
MAC plot test versus simulation for half casing
I carried out a mesh convergence study on the half casing as can been seen in Table 1 and the mesh sizing had little impact on the natural frequencies observed, a mesh size of 2.5mm led to a very large increase in the number of nodes compared to a 5mm mesh so a 5 mm mesh was used going forwards for all MASTA FE casing modelling.
| Mesh Size 10 mm | Mesh Size 5 mm | Mesh Size 2.5 mm | |||
| Number of nodes | ~ 100 k
|
~ 200 k
|
~ 2400 k
|
||
| Mode Number | Frequency (Hz) | Frequency (Hz) | % Difference to 10 mm Mesh | Frequency (Hz) | % Difference to 10 mm Mesh |
| 7 | 531 | 527 | 0.7% | 524 | 1.3% |
| 8 | 582 | 578 | 0.7% | 575 | 1.3% |
| 9 | 1005 | 997 | 0.8% | 992 | 1.3% |
| 10 | 1194 | 1185 | 0.8% | 1179 | 1.3% |
| 11 | 1308 | 1297 | 0.8% | 1290 | 1.4% |
| 12 | 1678 | 1662 | 0.9% | 1652 | 1.5% |
Mesh convergence study for half casing
To Summarise
We have developed an efficient procedure using MASTA software and in-built scripting capabilities to create a CAE model of a drivetrain and automatically generate accelerometers at the same locations as used in a modal test.
The procedure has been tested on a single drivetrain casing half and MAC analysis as well as mode frequency differences have been compared to validate MASTA CAE modelling.
An Average MAC number of above 0.4 across the leading diagonal was achieved up to 5kHz in all tests, and modal frequency differences of under 5% were seen for the majority of modes.
Join us in part 2 to learn about further modal tests we did on a full gearbox including internal components and validating against MASTA software.
If you’ve been inspired by this information, please contact us to learn more.
Images from ANSYS reproduced with permission of ANSYS, Inc.

