Hello and welcome back!
We validated MASTA modelling of a singular gearbox half casing against modal test data in Part 1 of this series of modal validation blog posts.
Part 2 expands on this research by including a full gearbox casing made of two separate halves bolted together.
Let’s Get Started
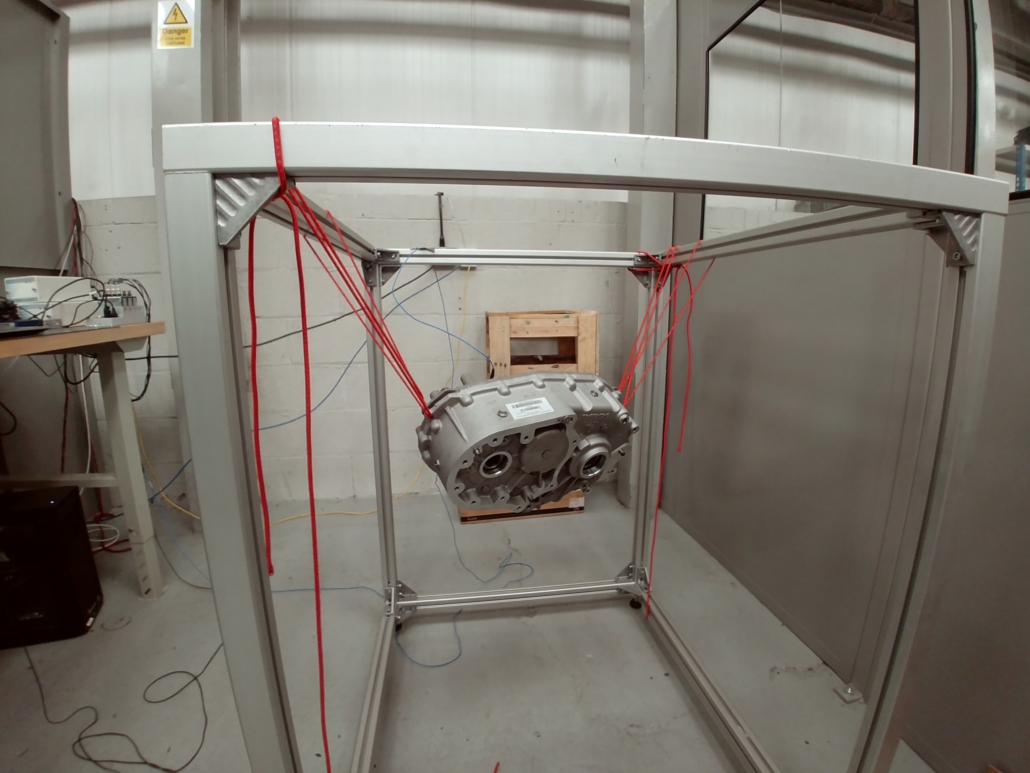
Modal tests were carried out in a similar fashion to that described in Part 1; using an impact hammer and roving accelerometer to capture mode shapes of the structure.
Casings bolted together test setup
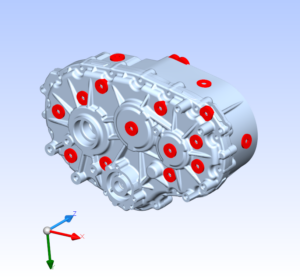
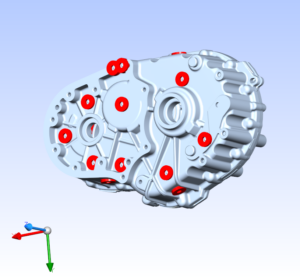
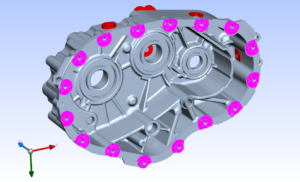
Casings bolted together MASTA model
To determine the best modelling practises, I considered MASTA model FE setup changes.
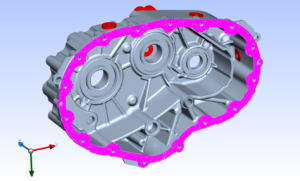
A bonded contact between two casing halves can be approximated as a singular contact, or as smaller locally bonded contacts at each bolt location.
There are a total of 16 bolts which have a mass of less than 2% of the total mass of the gearbox so are omitted from the MASTA model for simplicity.
Bonded surface contact setup with fully bonded and locally bonded contacts
What Did We Discover?
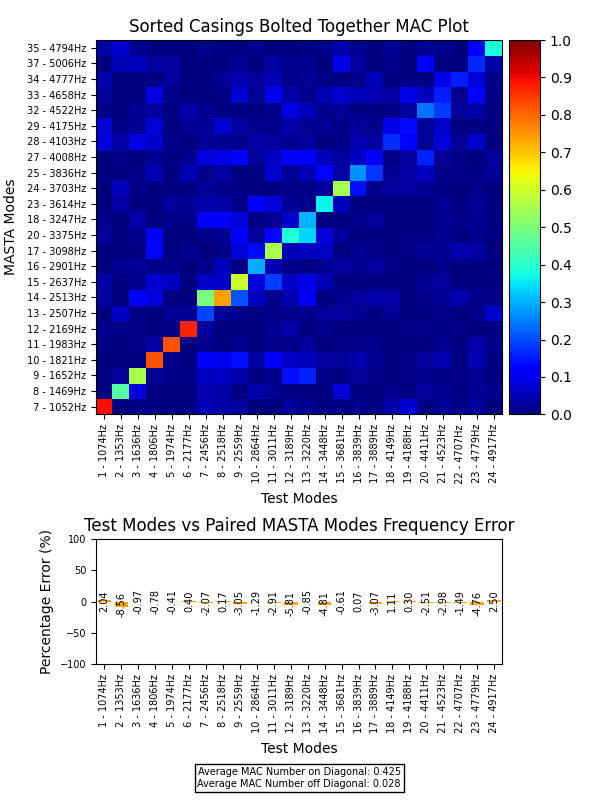
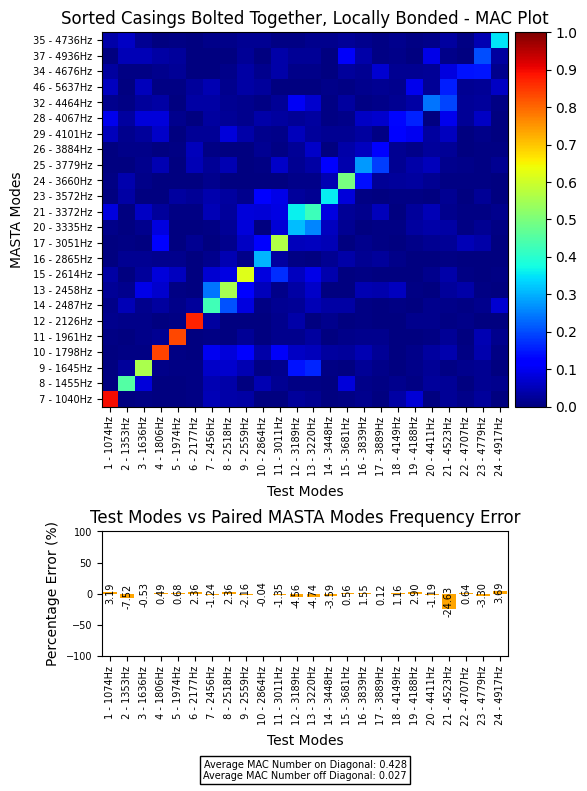
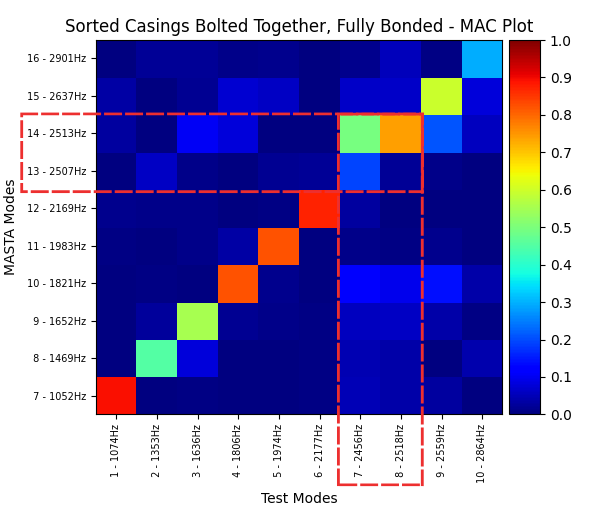
Test versus simulation Modal Assurance Criterion (MAC) plots show very good correlation has been achieved up to ~ 3 kHz, with correlation generally weakening as frequency is increased.
Frequency differences between modes are also mostly under 5%.
The impact hammer and accelerometer I used during testing have a recommended upper frequency limit of 5 kHz; and so results beyond this are not fully trusted.
The average MAC number on the diagonal for both fully bonded and locally bonded contacts is approximately 0.43, indicating that the bonding method has little impact on modal validation.
Natural frequencies are slightly lower in the case of the locally bonded model however as would be expected from the lower overall stiffness.
MAC plot test versus simulation for casings bolted together, fully bonded and locally bonded contacts
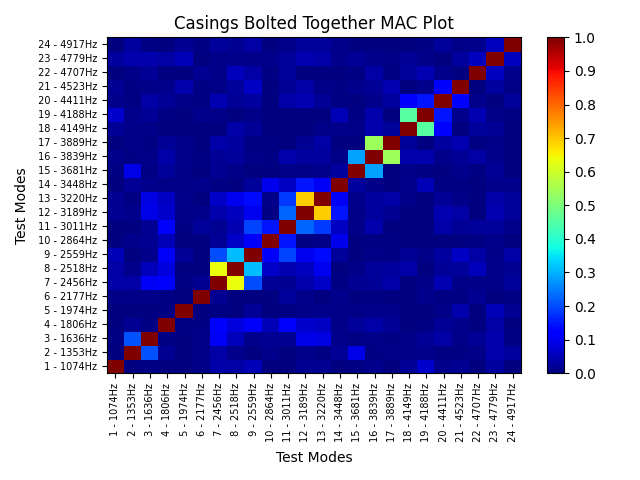
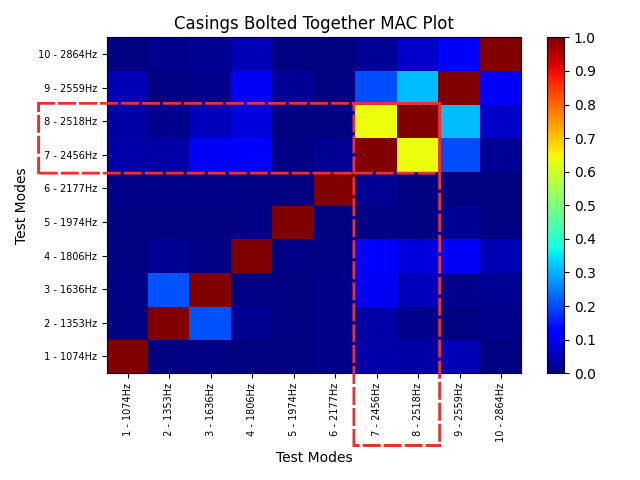
To ensure test validity I plotted a test vs itself MAC plot.
Overall there are minimal off-diagonal terms suggesting enough accelerometer positions were used to find accurate mode shapes.
There are a few off-diagonal terms with high MAC numbers, however these terms are between modes with similar frequencies, suggesting these modes are likely to be similar in shape.
MAC plot test versus itself for casings bolted together
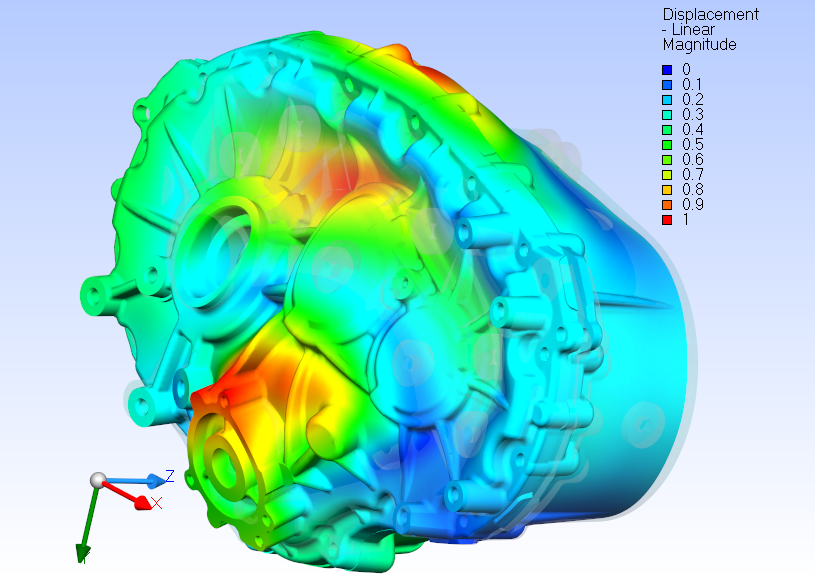
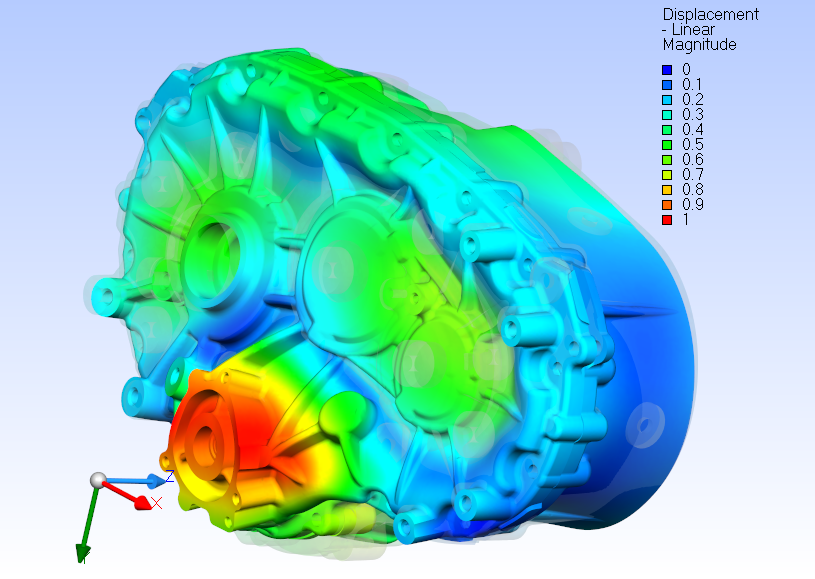
By closely inspecting the mode shapes in MASTA it was clear that modes 13 and 14 (test modes 7 and 8) are similar in shape and so a higher number of accelerometers would be required to separate these modes completely in test.
In reality it is impractical to place accelerometers at every location, highlighting the importance of a detailed simulation model.
MAC plots zoomed in
Modes 13 and 14 for casings bolted together fully bonded at ~ 2.5 kHz
Wrapping Up
Following modal testing validation of a single gearbox casing half in part 1 of this blog post, this has been extended to include casings bolted together and found an average MAC number of above 0.4 across the leading diagonal was achieved up to 5 kHz for two bonding methods, and modal frequency differences of under 5% were seen for the majority of modes.
The results achieved here are particular to this gearbox design and bolt configuration up to 5 kHz.
It is possible that for different designs and/or higher frequencies the bonding method becomes more important.
Join us in part 3 as we expand this study to a full gearbox casing with internals of gears, shafts and bearings.
If you’ve been inspired by this information, please contact us to learn more.

