In this blog we investigate the effect of gear tooth pitch errors in MASTA.
Pitch errors (PEs) which are a direct consequence of the quality of gear manufacturing can have a distinct effect on vehicle NVH by producing sidebands.
Pitch error is where the flank of a gear tooth is displaced from its position relative to the adjacent tooth, shown here by the red line.
Sidebands occur when a harmonic signal is modulated periodically, creating several closely spaced orders (sidebands) around the main order.
As sidebands are very similar in frequency to the main order, they are not perceived as distinct tones being instead heard as a modulation of the main order.
To demonstrate the modulation effect, I have created some artificial signals, both are run ups between 100 and 9000 rpm.
The first contains a single order 26.
The second contains order 26 and sidebands of orders 25 and 27 which have half the amplitude of the main order.
As you can hear sidebands can make a big difference to the noise making them an important consideration for NVH troubleshooting.
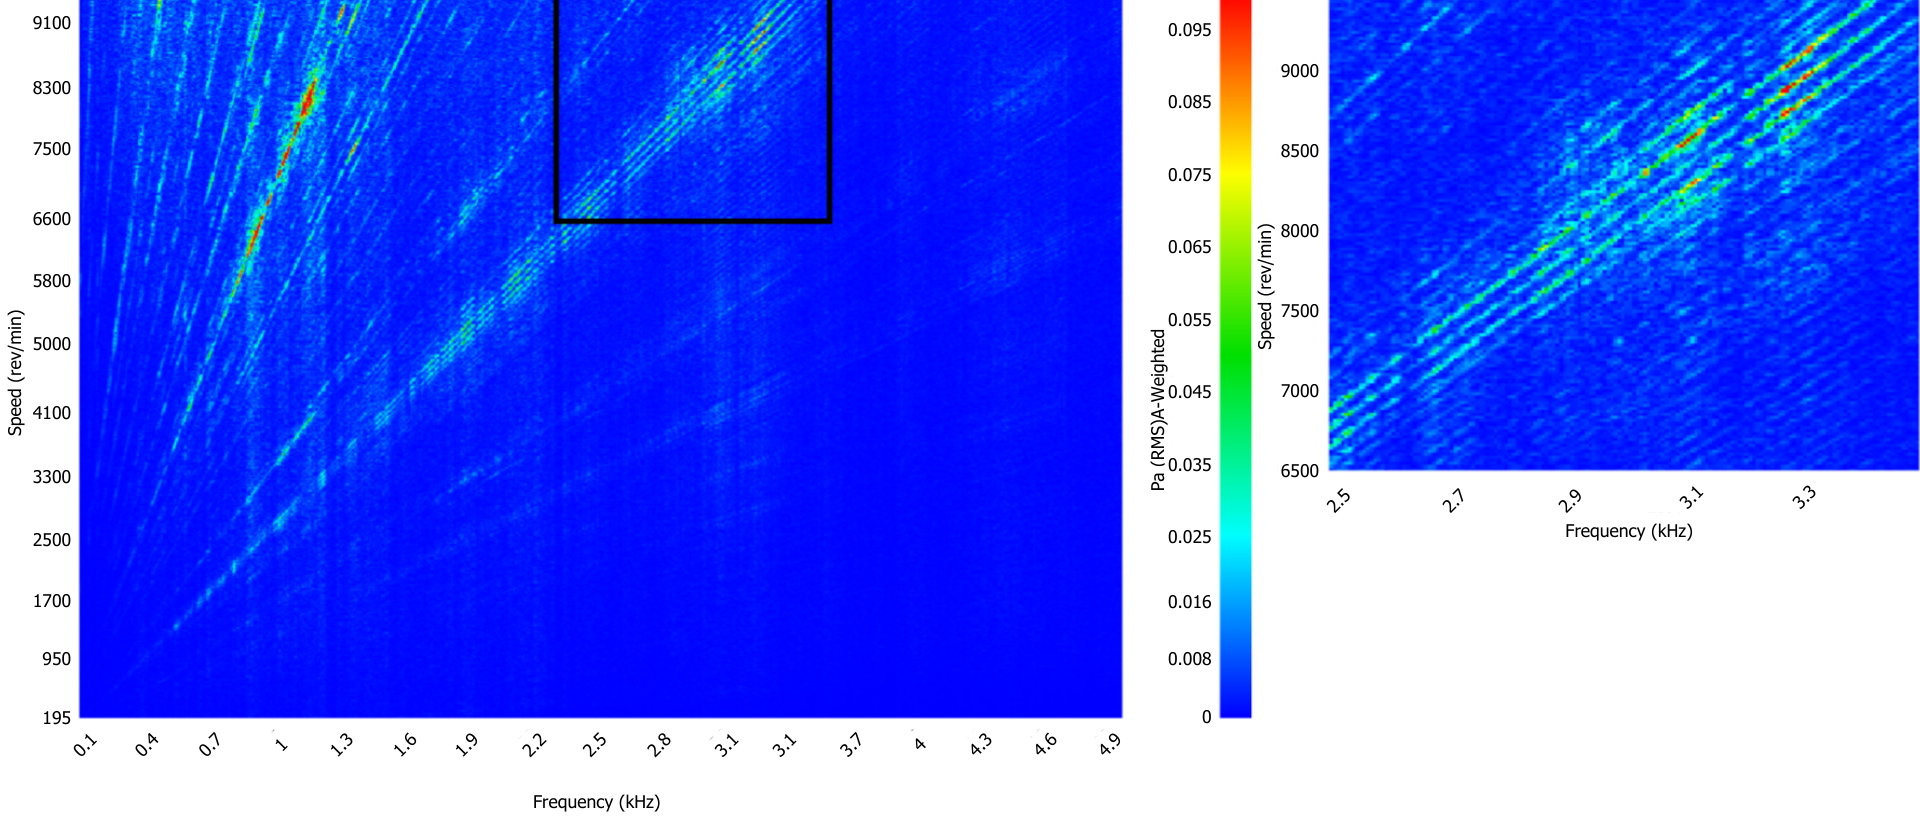
An example of what a sideband problem might look like in test data is shown below. In this example waterfall plot, we can see an area of sidebands around 3 kHz.
Example of Sidebands in Microphone Data
Sidebands In MASTA
To simulate the effect of gear excitation we will use harmonic analysis. This solves for the response of our system to vibration in the frequency domain.
In MASTA the harmonic response mode provides many different excitation options, allowing us to choose the appropriate fidelity for the result we are interested in.
To simulate sidebands due to gear PE we generate an excitation for the harmonic analysis by running MASTA’s Advanced System Deflection (ASD) mode.
This runs a series of separate quasi-static analyses at different time steps.
ASD is faster than running a full dynamic analysis and can capture the effect of the gear pitch errors.
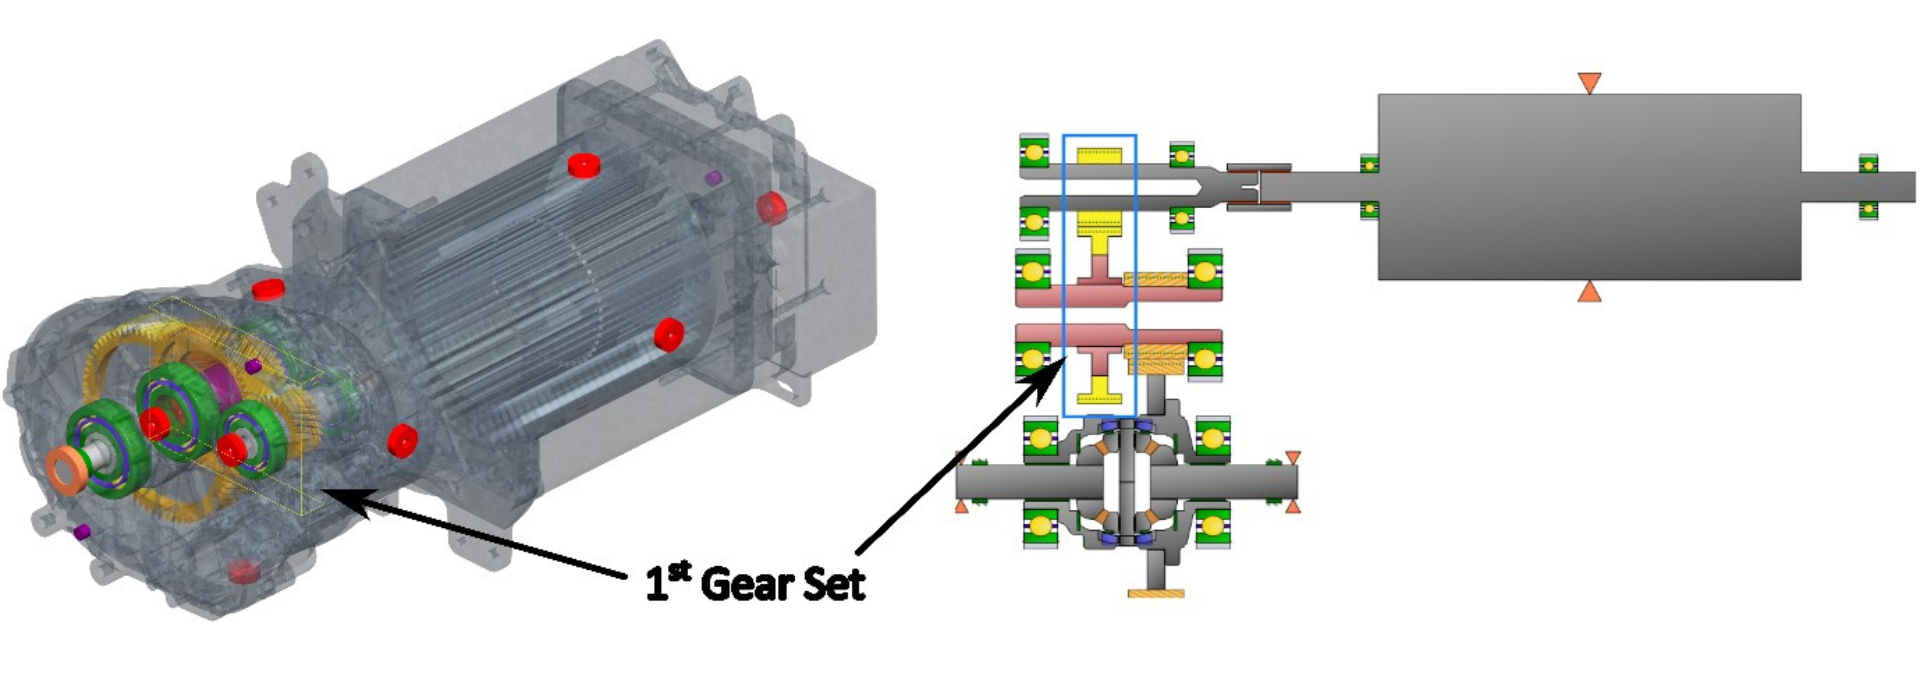
As an example, we will simulate sidebands in the first gear set in a two stage EV model and use the transmission error (TE) of this gear set as the excitation in our harmonic analysis.
Example Electric Powertrain
Let’s look at what happens when PE is included on both the pinion and wheel.
To fully capture the effect of this modulation on the TE we will generate excitation data from every tooth on the pinion passing every tooth on the wheel, running for
26 (Pinion Tooth Number) x 59 (Wheel Tooth Number) = 1534
tooth passes.
This generates a full cycle of the signal ie. the signal has gone through a full oscillation and got back to where it started.
Tip:
When a Fourier transform is taken of an incomplete period the result will not capture the full amplitude of the harmonics present and may produce spurious harmonics, this is known as spectral leakage.
4 Full Cycles of a Signal, No Spectral Leakage.
Signal ends before completing 4th cycle, creating spectral leakage.
Tip:
If insufficient points are included in a tooth pass the Fourier transform will fail to reach a sufficient frequency to capture the tooth passing order. This can be seen in the results per period below where the orange signal does not include enough points to capture the 4-cycle oscillation appearing to contain only 2 oscillations.
Example of under sampled signal.
To obtain sufficient resolution to see tooth passing frequency we will use 10 steps per tooth pass.
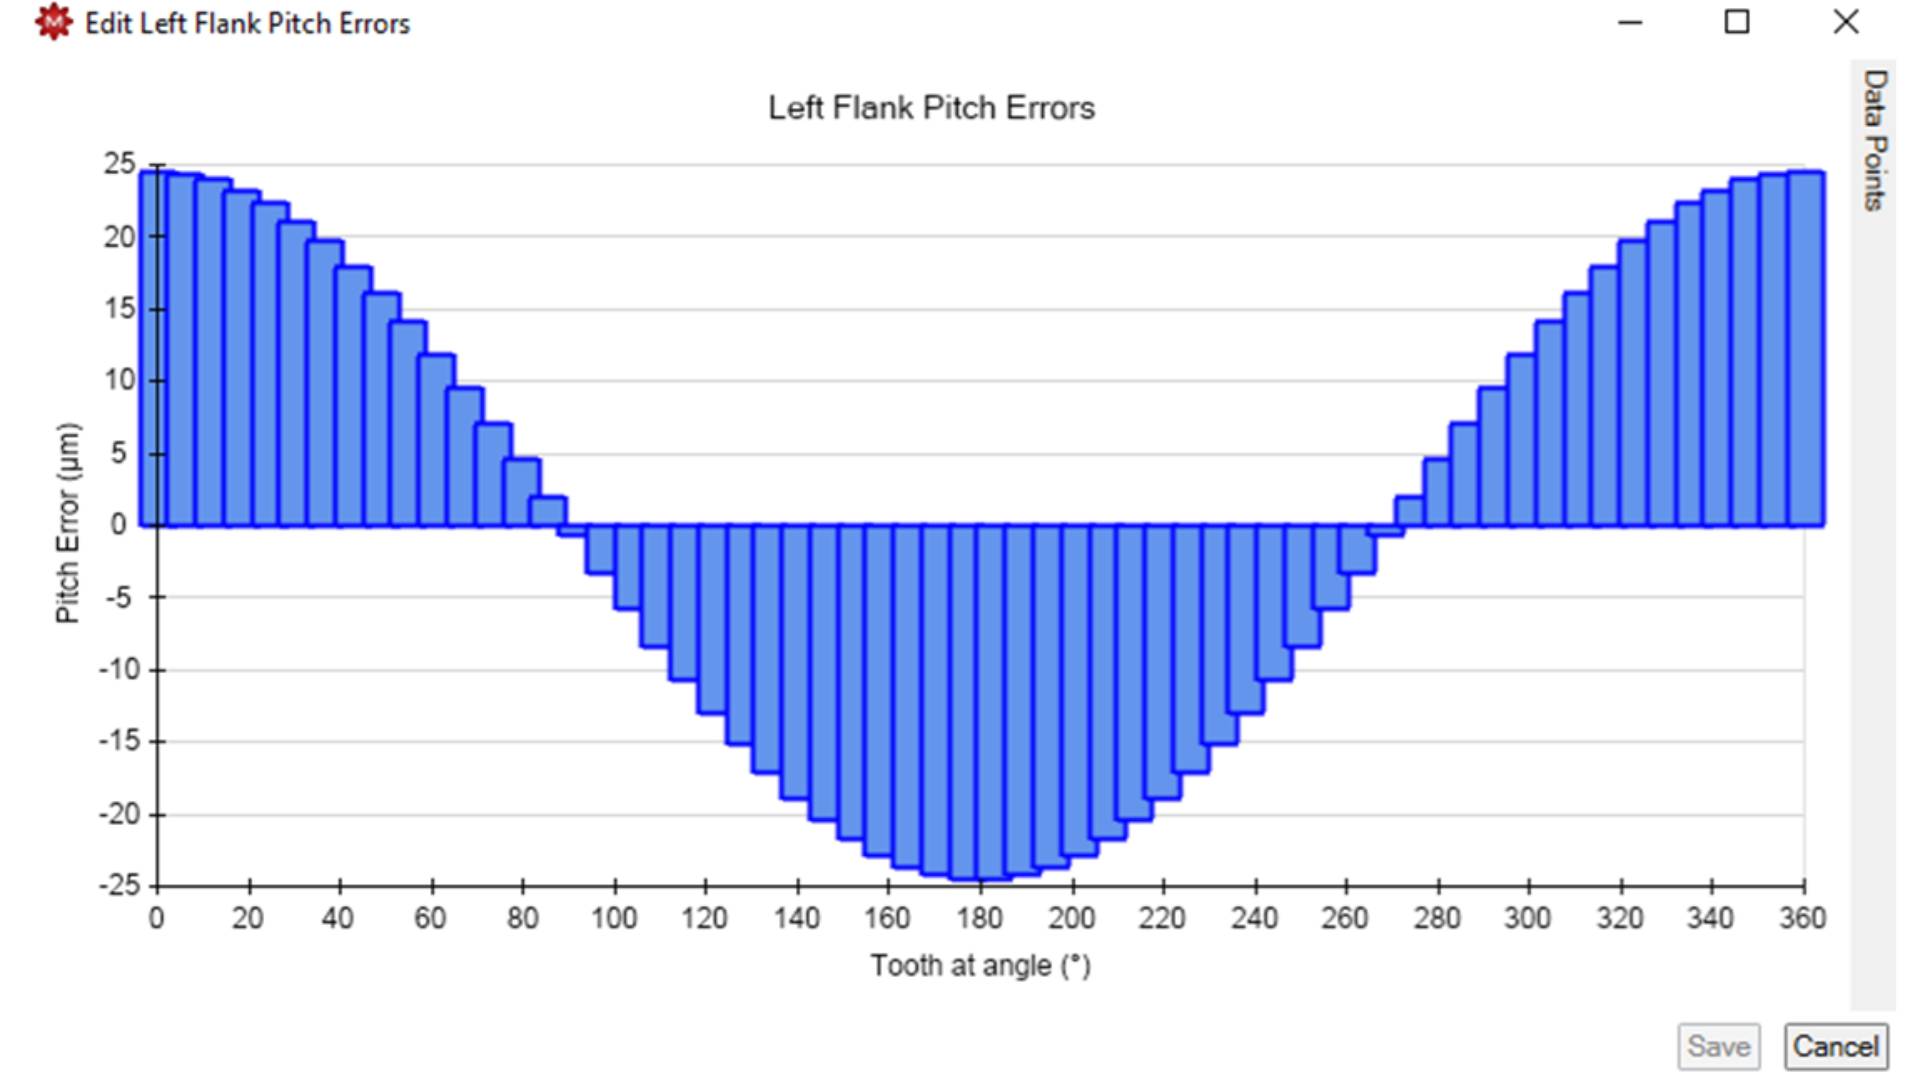
To include a pitch error the gear quality is changed to ISO grade 7 as specified in ISO 1328 – 1:1995.
At this ISO grade the PE has an amplitude of 18.5 µm on the pinion and 24.5 µm on the wheel.
An example of the PE on the wheel left flank can be seen below.
Example of Pitch Errors.
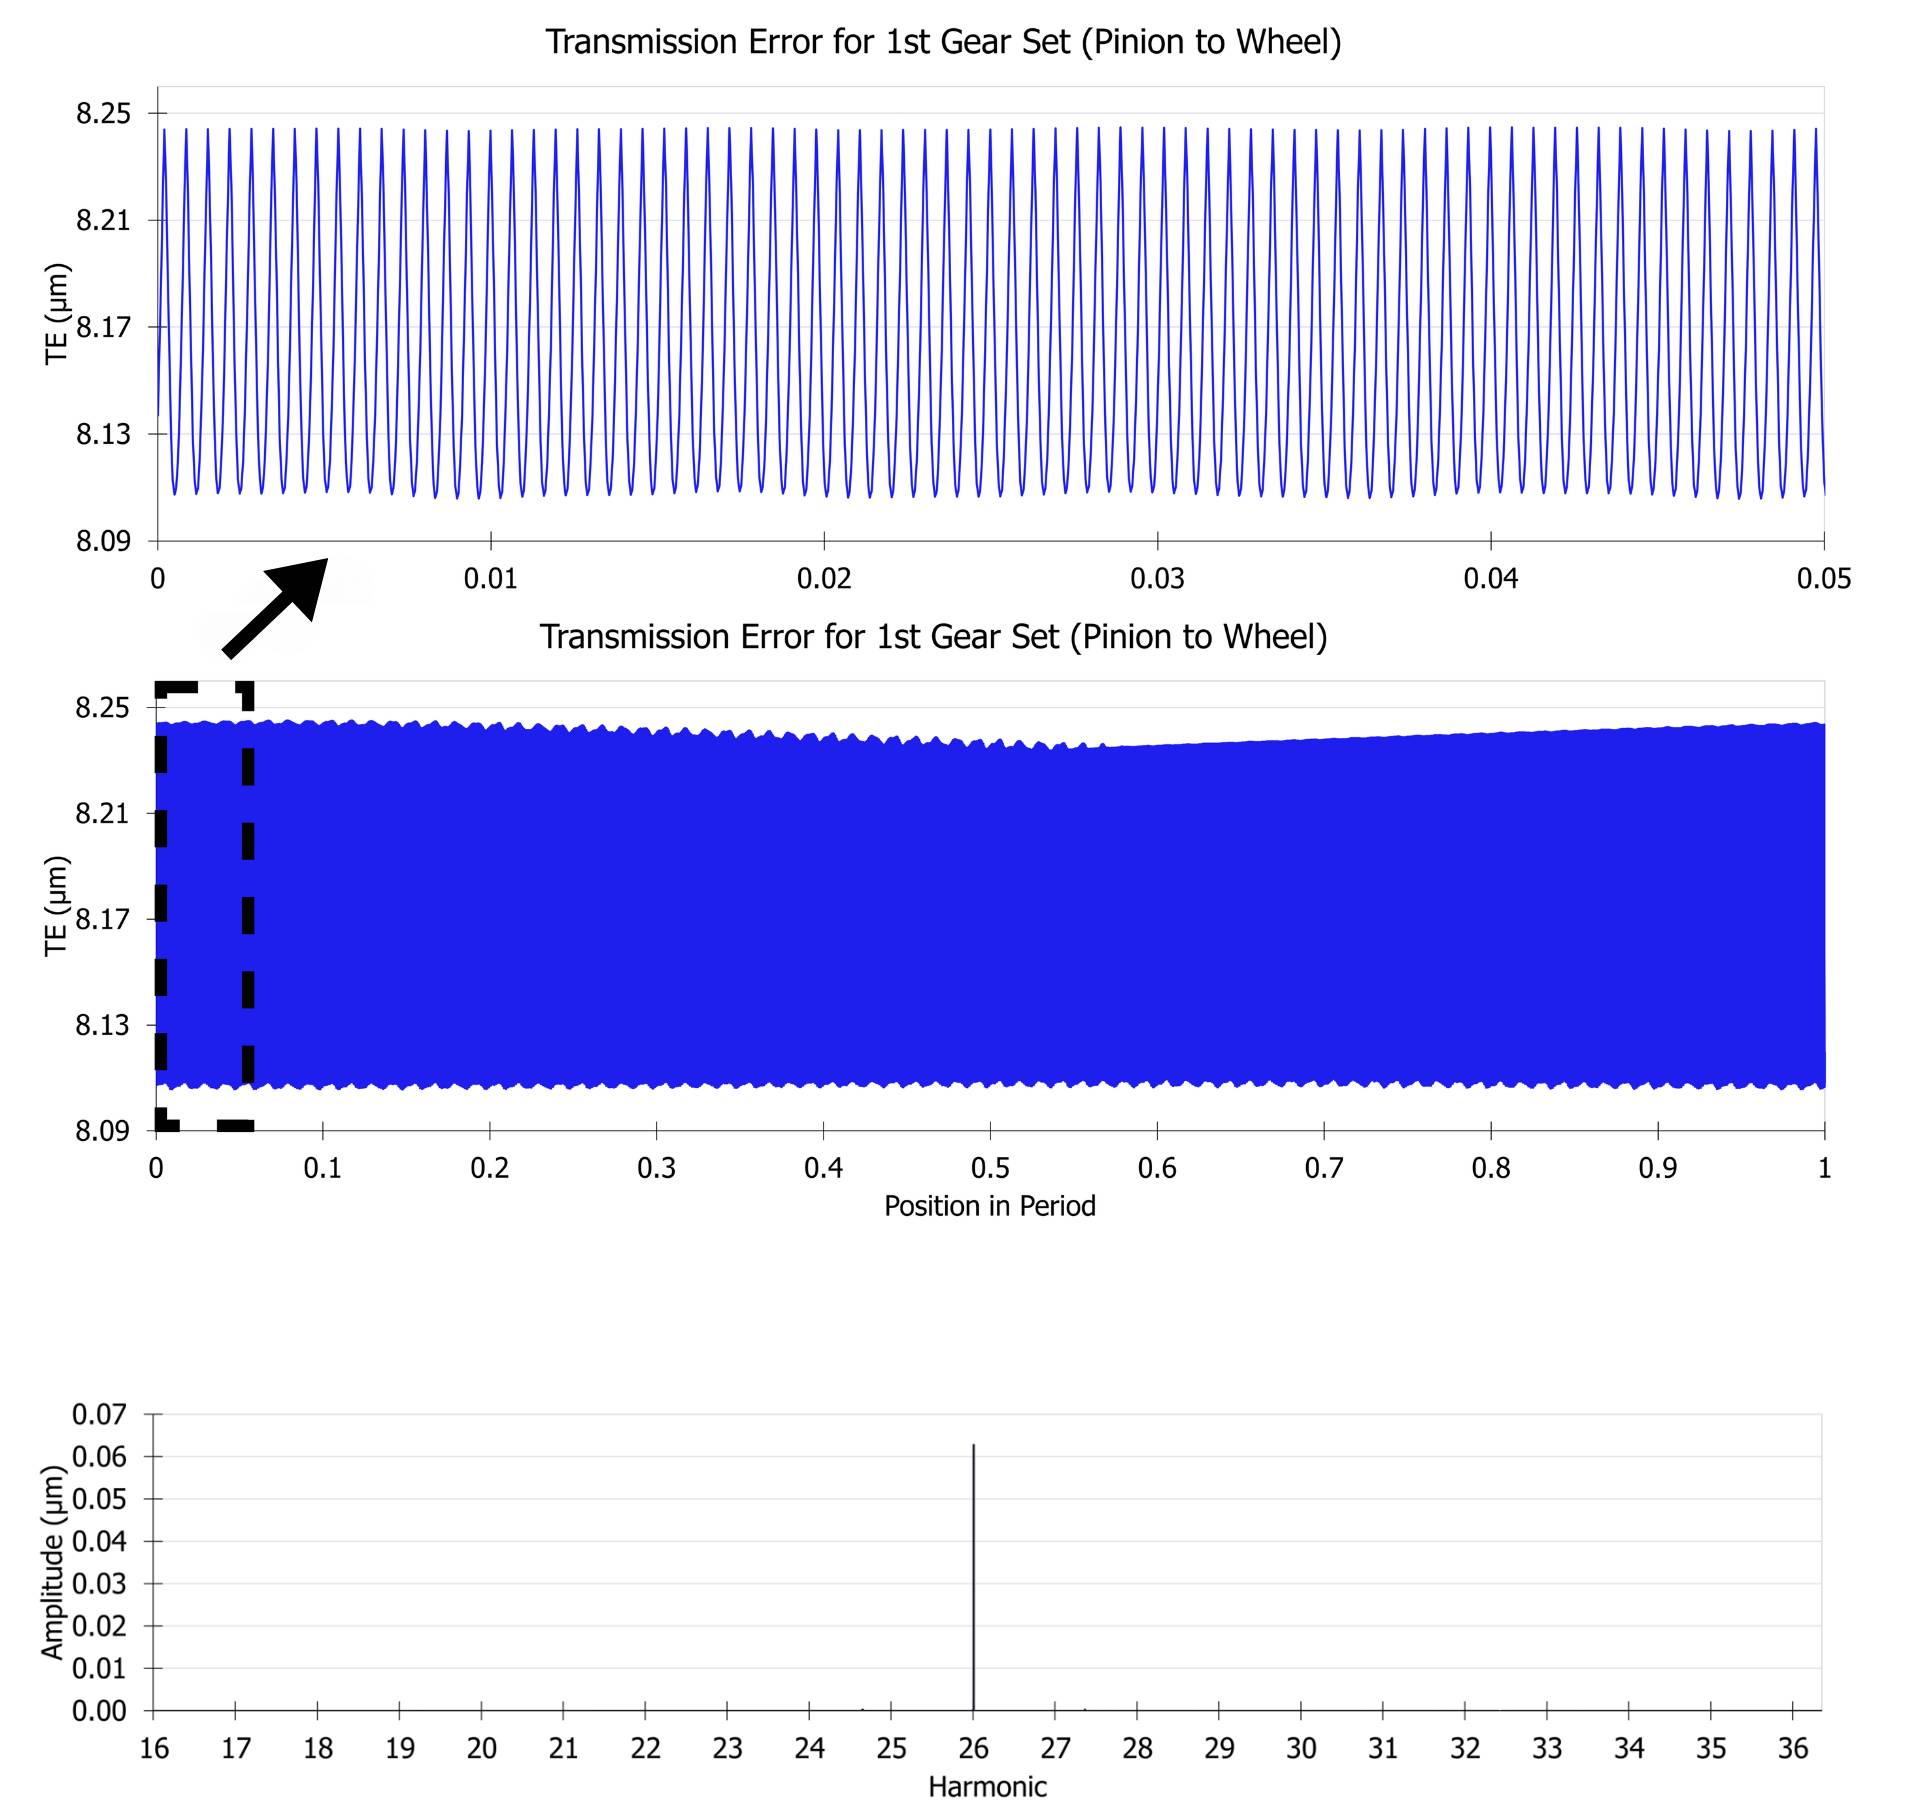
Without the PE we expect to see just the tooth passing order 26 referenced to the input shaft in the TE and that is what we get in MASTA.
TE of first gear set without manufacturing errors.
In contrast adding our PE on both the Pinion and the Wheel gives a much more exciting TE, with many different frequencies of oscillation.
The oscillation which occurs 59 times in a period is due to the PE on the Pinion and the oscillation which occurs 26 times is due to the PE on the wheel.
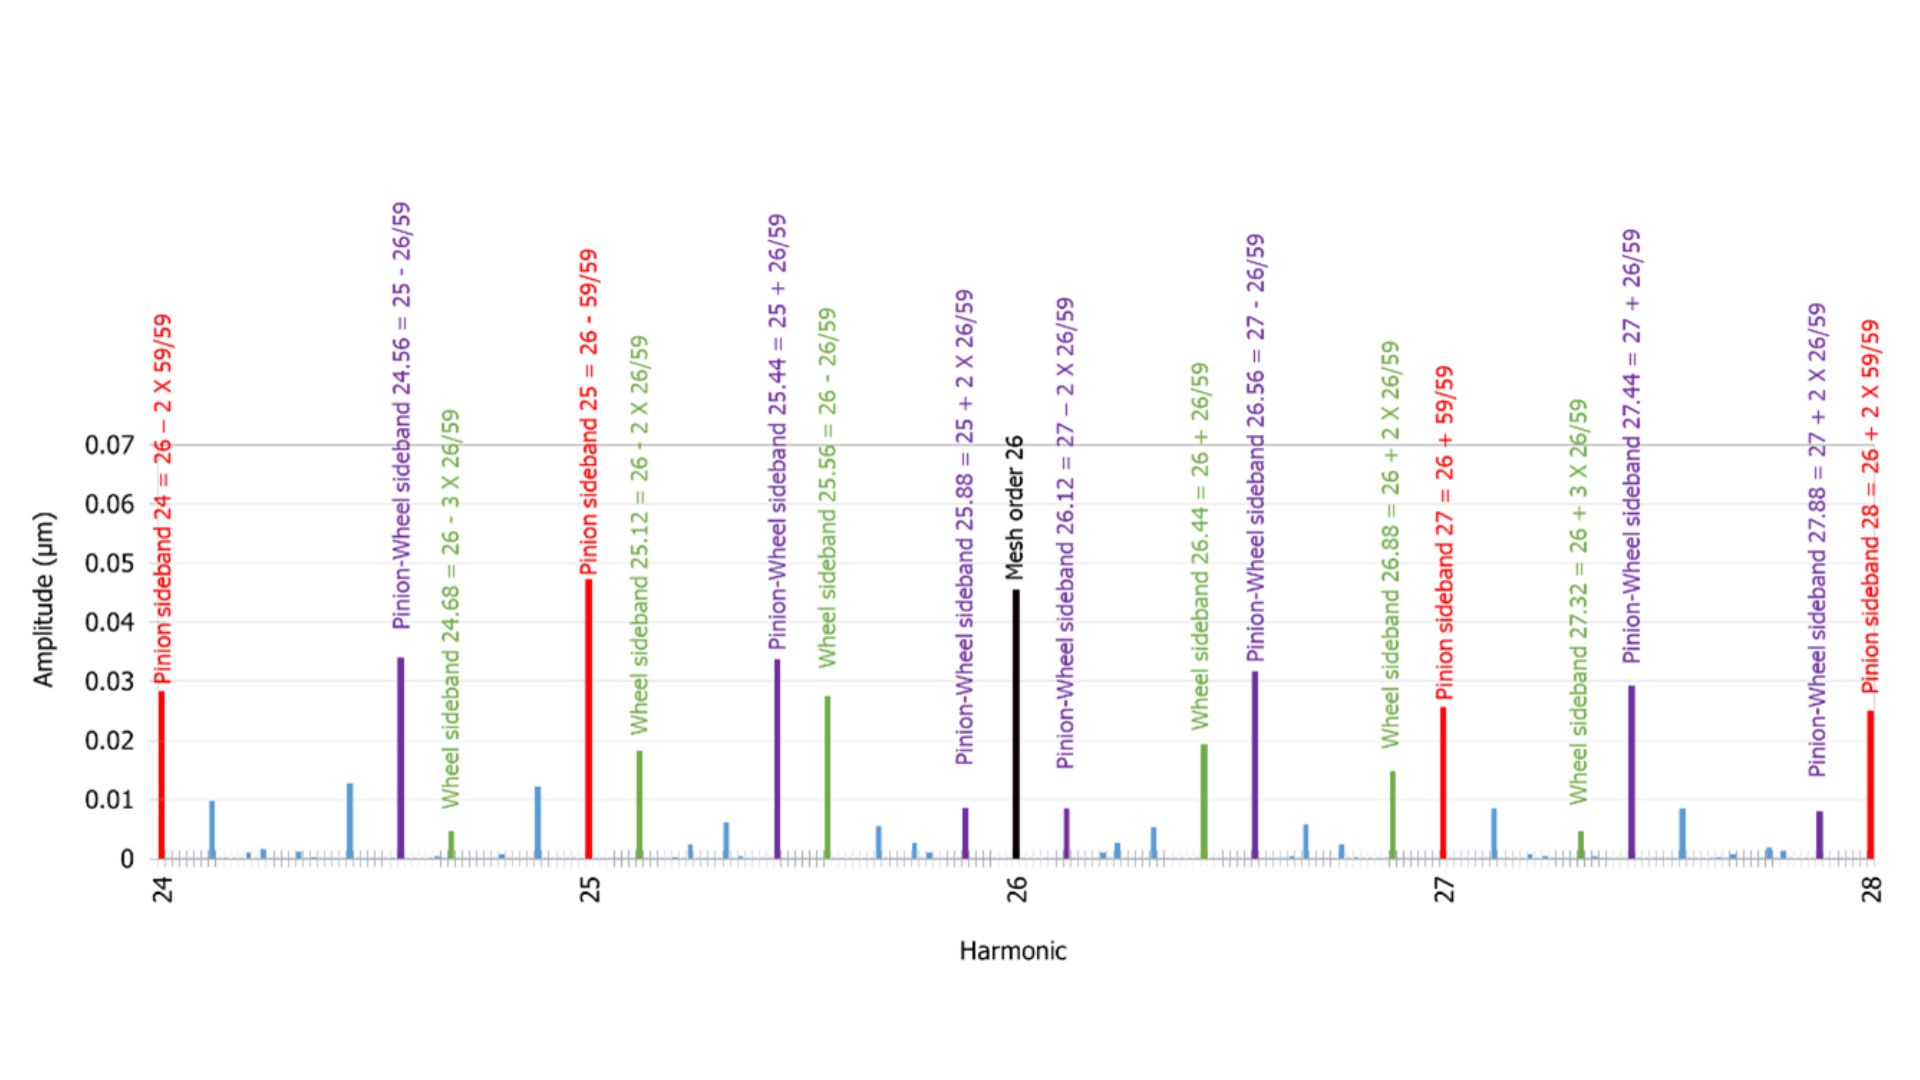
Both modulations cause sidebands; the pinion PE causes sidebands at +1 of the mesh order while the wheel causes sidebands ±26/59 = 0.441.
TE of first gearset including PE on both gears.
Labelled orders in TE for case with PE on both gears.
However, we can see many more than just these sidebands in our signal.
These sidebands can be identified as a combination of sidebands due to multiples of the pinion and wheel such as 28 = 26 (mesh order) + 2 x 1 (pinion sideband) and sub sidebands formed by a sideband modulating a sideband.
I have labelled pinion sidebands in red, wheel sidebands in green and sub sidebands in purple to demonstrate.
What do I mean by a sub sideband?
Take 27.44 as an example this is modulation of pinion sideband 27, by the wheel sideband 0.44.
We can imagine how this might occur by thinking about what the PE is on the teeth in contact as the gears rotate.
We start with the teeth with maximum PE on both the pinion and the wheel in contact.
Now if we then rotate the pinion once the tooth with maximum PE on the pinion will be back in contact.
However, the wheel has only completed 0.44 of a rotation so we haven’t got back to the tooth with maximum PE, and don’t expect the same TE.
To get back to where the pinion and the wheel have maximum PE requires every tooth of the wheel to have passed every tooth of the pinion.
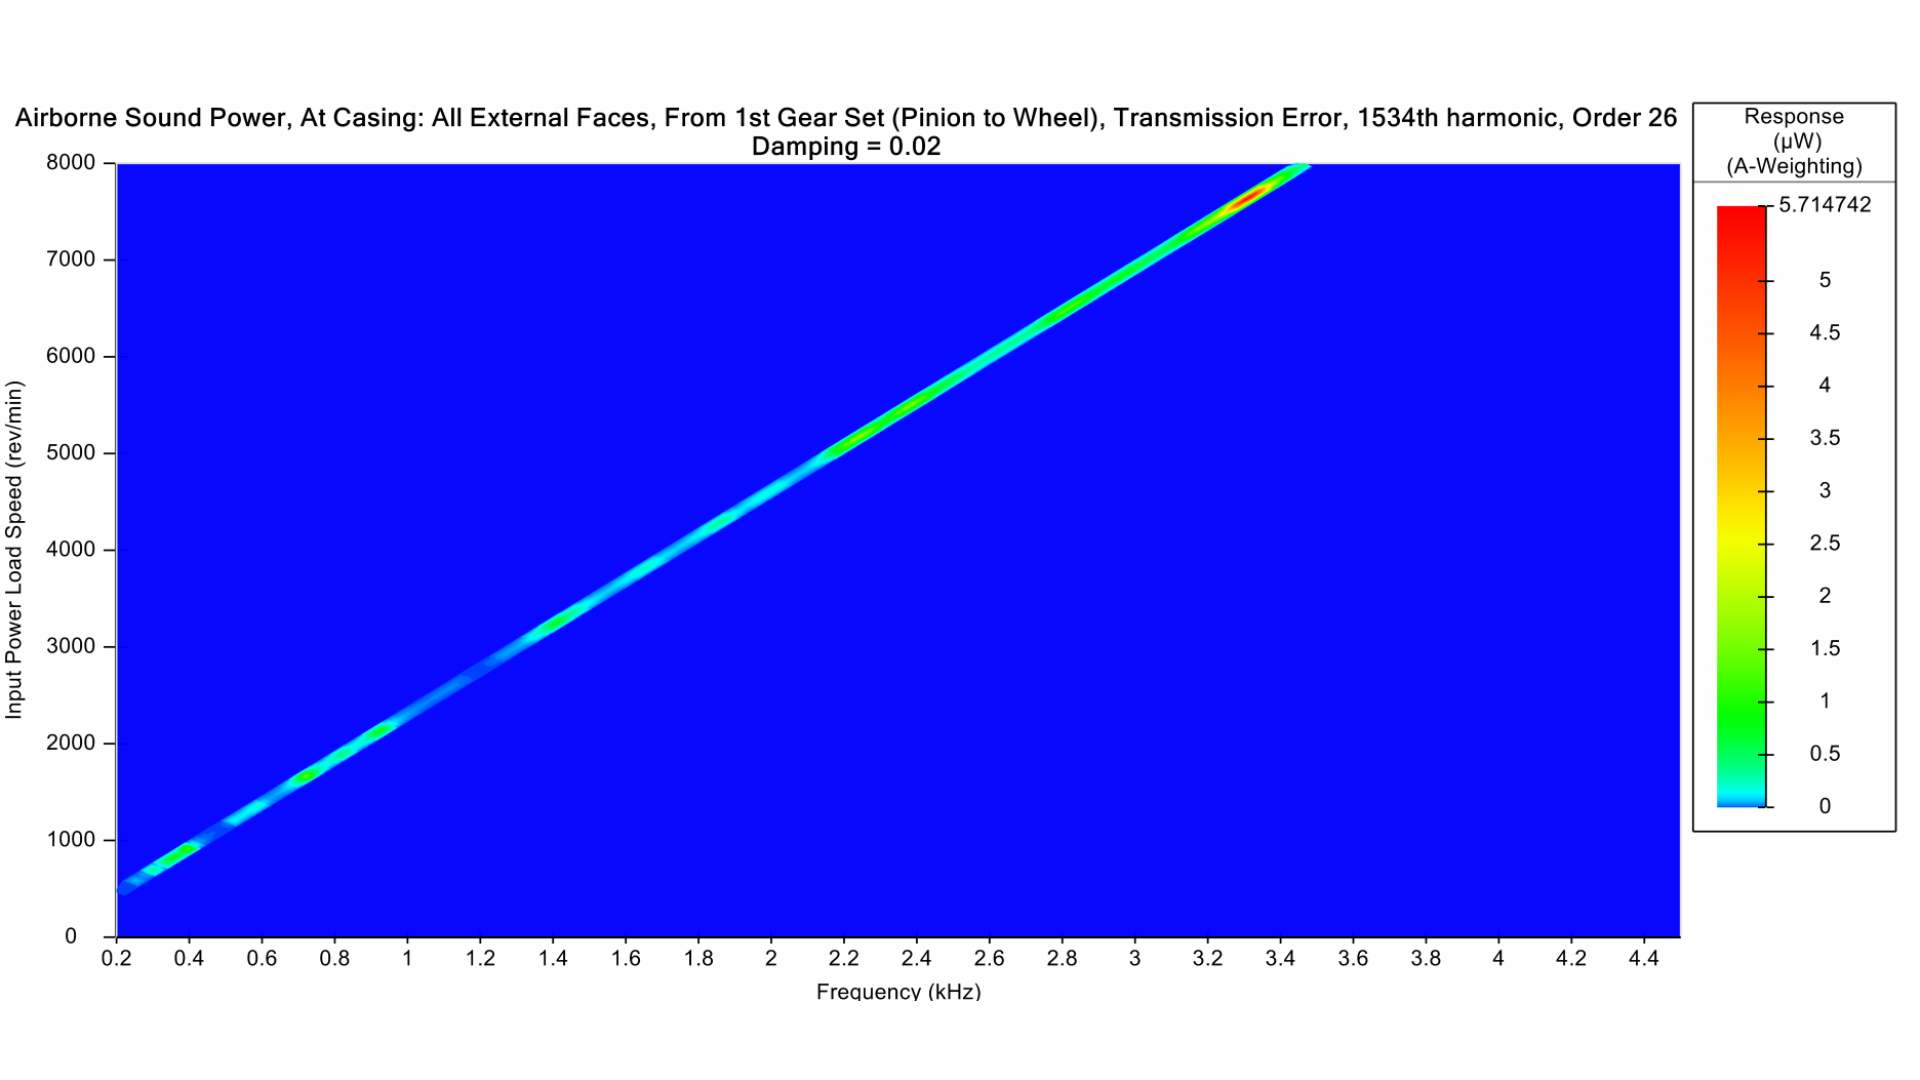
Airborne sound power on the gearbox casing when no manufacturing errors are included.
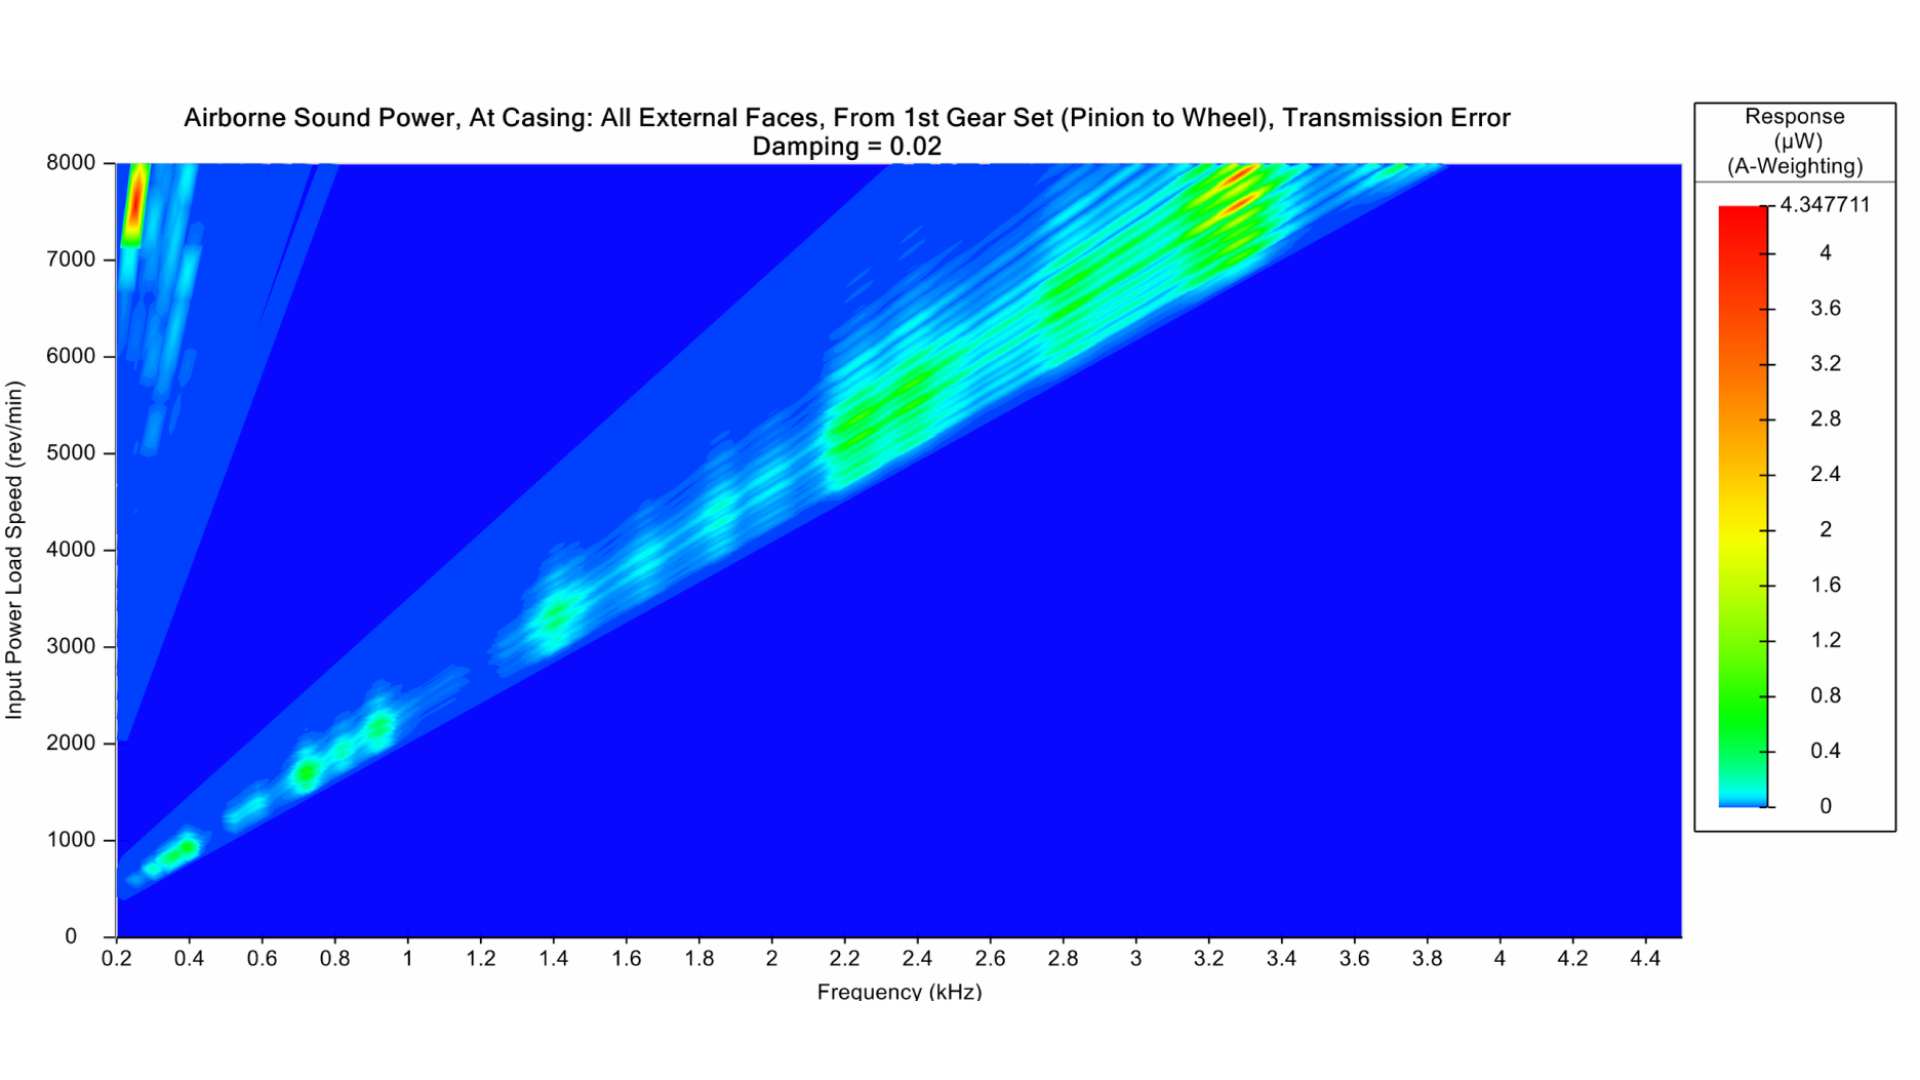
Airborne sound power on the gearbox casing when PE is included on both gears.
Using the TE results we have just been talking about as excitation for our harmonic analysis we can see how manufacturing errors, like gear PE, effect NVH performance parameters, like airborne sound power.
The figures above show the airborne sound power with and without PE applied.
We can see how in the case with PE there are sidebands appearing around the main order as seen in the test data earlier.
These results are for demonstration on an example model, keep following SMT for blogs on NVH correlation to test data.
Thank You For Reading
I hope this blog post has given you some useful information about how to simulate sidebands due to gear PE in MASTA and how sidebands may be related to manufacturing errors.
For further information about NVH in MASTA you can check out some of our past webinars.


